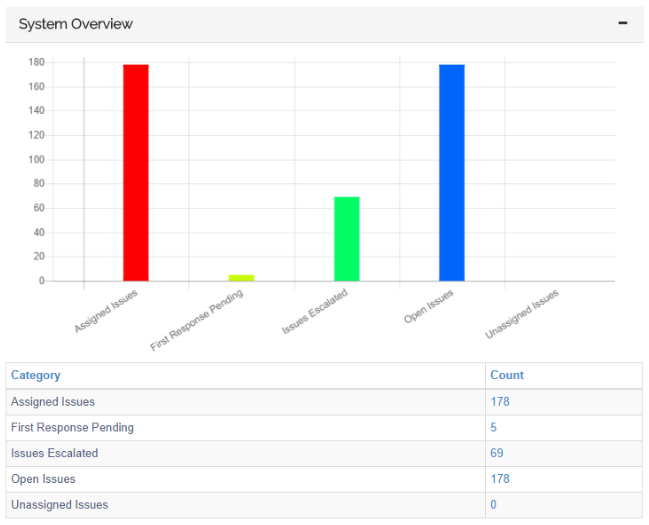
The Dashboard is a user-specified display of at-a-glance statistics regarding open issues. A user must have Dashboard permissions within their Menu Options / Pages Allowed to view the Dashboard. If Issue Classes are enabled, selecting a Class in the Show Class drop-down in the upper right corner will filter the issues displayed on the Dashboard to that particular Class.

The Dashboard may be used as your Home Page. Otherwise, it is accessible from the left menu under the Issues submenu. Once the Dashboard is open there is the option for Dashboard Settings where you can set your own Dashboard preferences in the top right.
Dashboard Settings
To navigate to the Dashboard Settings page, you would click Issues from the left menu > Dashboard > then click the Dashboard Settings link towards the top right of the screen while viewing your Dashboard. Below is a walkthrough of this screen from top to bottom:
- Select the Dashboard Panel you want to add to your Dashboard from the "Select a Panel" drop down.
- Click Add to Left Column or Add to Right Column as appropriate.
- Move the panel to its appropriate display order within the right or left column by manipulating the miniature buttons within the panel.
- The UP arrow moves the panel up on the Dashboard.
- The DOWN arrow moves the panel down on the Dashboard.
- The red X removes the panel from the Dashboard.
- Repeat these steps for any additional panels you want to add.
- Click Save to save the layout, OR...
- If you are a Sys Admin and you are setting up the default Dashboard layout for all users, click Set as Default.
- If you are a Sys Admin and you are setting up the dashboard to your own preference, click Set as My Dashboard.
Dashboard Panel Options
Certain Dashboard reports provide additional display options when viewed from the Dashboard itself. These options are presented as icons in the upper right-hand corner of each report, and they can be toggled to change how the reports appear to the user. For example, when an icon is dark, it has been enabled.

The above image will result in the report having both graph and chart data displayed for the user. When the icon is lighter, the option has been disabled.

The above image will result in the report only showing the data in graph form.
Default Dashboard Layout
If a Sys Admin sets a default Dashboard layout, it will affect only users that have not set their Dashboard preferences.
Status Indicators
When viewing lists of issues in the Dashboard, there are several status indicators that can appear in the lefthand column. Here is a list of indicators and what they mean:
- E - Escalated issue. This issue was processed by an automation workflow rule.
- G - Global Issue.
- L - Linked Issue.
- Paperclip - Has attachments.
- 0/3 (or any other number/number displayed) - Indicates how many tasks have been completed out of the total present on this issue.
- Red Circle - Out of SLA compliance.
- Yellow Circle - Halfway out of SLA compliance.
- - Has Billing line items.
